
1. What is Portfolio Optimisation?
Given:
- A set of equities
- Target return
Find:
- Allocation to each equity that minimizes risk
Given a set of equities that you want to invest in and a target return that you want to achieve, a portfolio optimiser will calculate the best weights of those equities to give you the lowest risk for that portfolio.
2. Risk
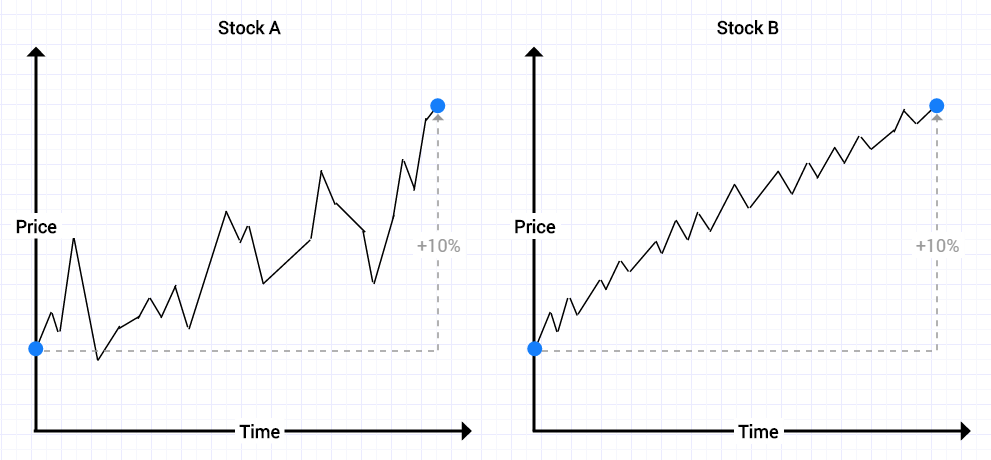
- Stock A and Stock B both rise 10% over a given period of time
- Stock A is much more volatile than Stock B – large peaks and troughs
Stock B is less risk than Stock A given the same 10% return:
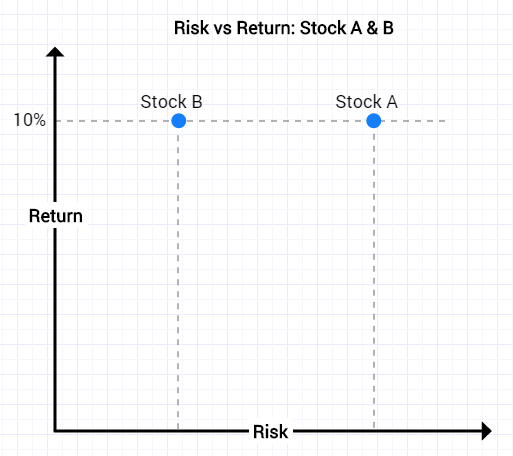
We can measure the risk of a stock through its volatility:
Risk = Volatility = Standard Deviation of Returns
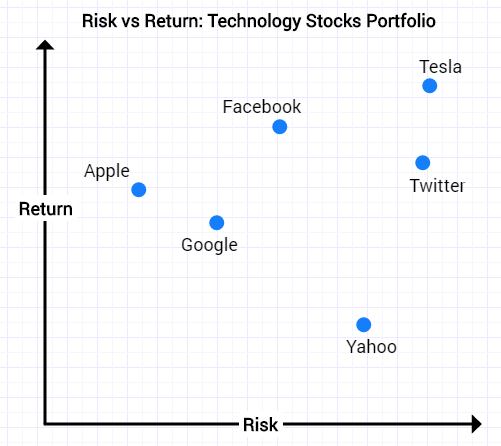
3. Portfolios
A portfolio is a weighted blend of assets
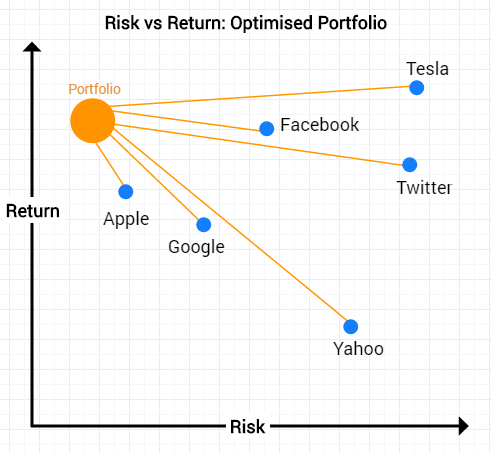
We can consider a portfolio containing technology stocks. We can view the stocks using a Risk vs Return graph. As is usually the case, the highest return stocks tend to have the highest volatility (risk).
When we build a portfolio by allocating a weighted amount of cash to each one of these equities, we get a portfolio that is a weighted combination of these equities.
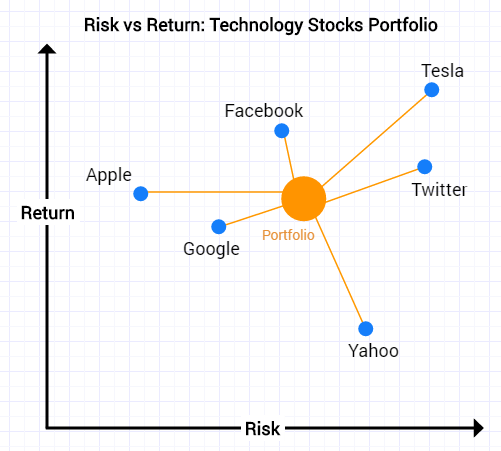
Now the portfolio itself is somewhere on this graph. It has a certain amount of risk and a certain amount of expected return and you would guess that it would be somewhere in the middle of all the equities.
Portfolio optimisation allows us to do better than this ‘middle ground’. We can find portfolios that for a given target return may have lower risk than any of the individual equities.
4. Portfolio Optimisation
What goes into a portfolio optimiser?
Inputs:
- Expected return for each equity
- Volatility (risk) for each equity
- Covariance matrix
- Portfolio target return
Output:
- Portfolio weights for each equity that minimise risk for target return
These relationships are found through a technique called optimisation which is an iterative process.
5. Covariance Matrix
What is the covariance matrix?
- The covariance is the correlation (similarity) between different objects
- Covariance measures the degree to which two variables are linearly associated
- Correlation is a scaled version of covariance that takes on values in [−1,1] with a correlation of ±1 indicating perfect linear association and 0 indicating no linear relationship.
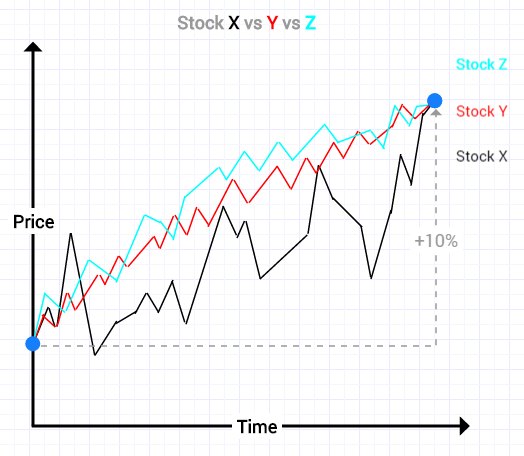
Let’s take a look at covariance in the context of three different example stocks:
- Correlation = Covariance
- A high positive correlation means the two stocks move together (e.g. Apple and Intel or Z and Y)
- A low negative correlation means the two stocks move opposite to one another (e.g. Tesla and General Motors or X and Z/Y)
- Stock Y and Stock Z move closely together and are closely correlated
- Correlation between Stocks Y and Z = 0.9
- Stock X shows the same return of 10% over a given time period but moves in an opposite direction to Stocks Y and Z
- Correlation between X and Y = -0.9
- Correlation between X and Z = -0.7
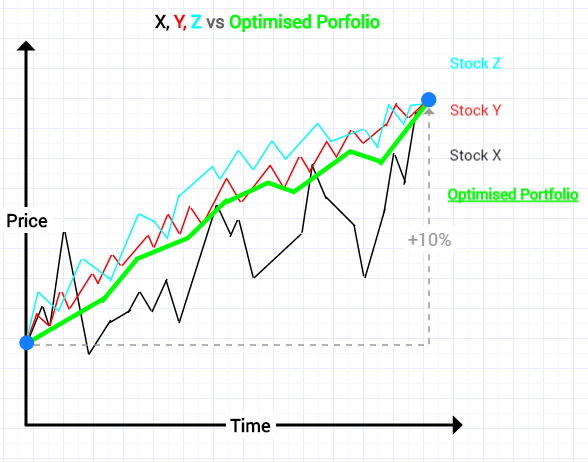
The purpose of portfolio optimisation is to combine all three stocks to reduce volatility but give the same return of 10%.
For example, the optimum weights for a portfolio containing Stocks X, Y and Z with a target return of 10% could be:
- X = 50%
- Y = 25%
- Z = 25%
Now the portfolio is diversified because Stocks Y & Z are anti-correlated to Stock X. As we can see below, we have smoother less volatile performance:
6. Efficient Frontier
For each target return there is a unique portfolio – that is the minimum risk portfolio for that amount of return.
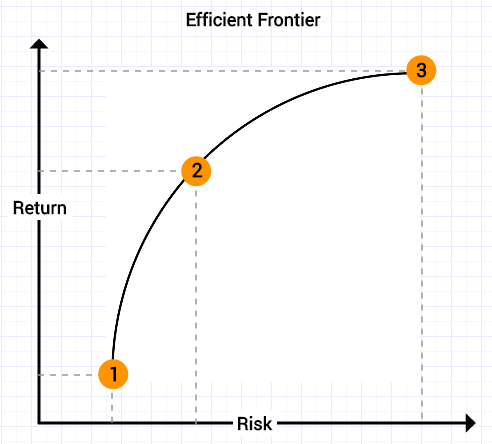
The line represents an infinite number of different portfolios with each one giving a different target return.
- Minimum risk portfolio: lowest volatility but has lowest return
- Balanced risk-reward: this is the maximum Sharpe Ratio – maximises the ratio of return to volatility (Sharpe Ratio)
- Maximum return portfolio: highest return but often highest risk